01 / DIAGNOSE
The BI Audit
A forensic review of your data landscape, reporting friction, and decision gaps.
- Infrastructure review
- Blind-spot map
- Prioritized action plan
I turn scattered business data into a governed decision system—from Fabric lakehouse and semantic model to the executive screen where the next move becomes obvious.
Every tile opens a live Power BI experience. These are operating tools, not decorative case studies.
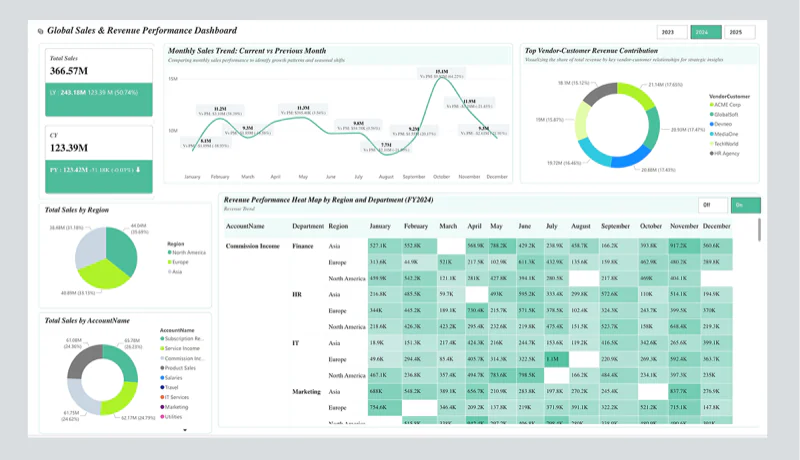 ↗
↗Multi-region sales intelligence
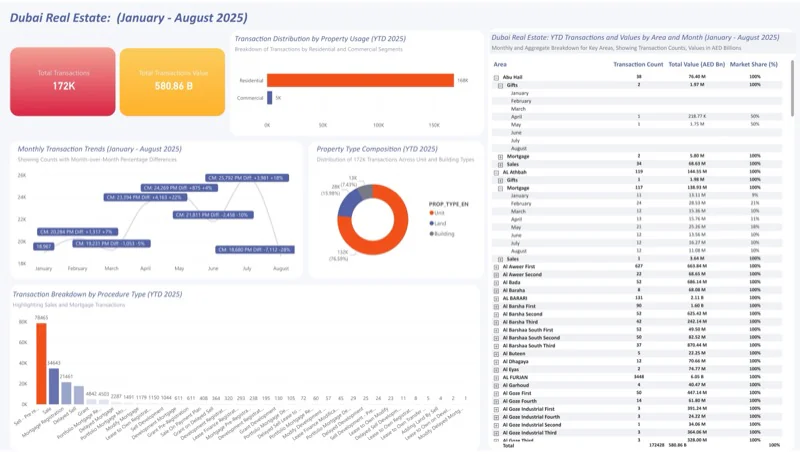 ↗
↗Dubai property signals at a glance
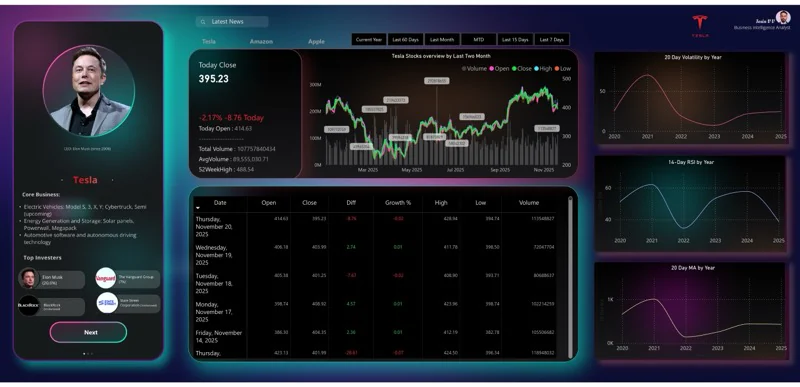 ↗
↗Market momentum and entry signals
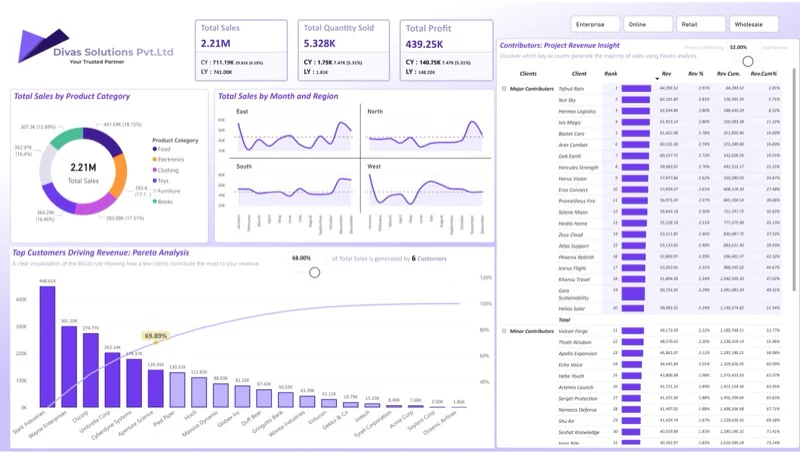 ↗
↗The 20% driving 80%—identified
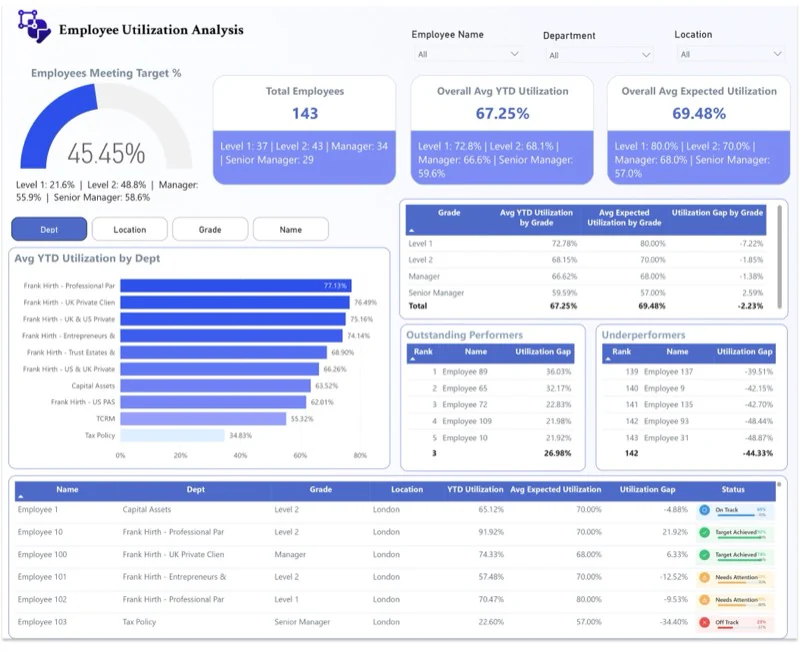 ↗
↗Idle capacity into billable output
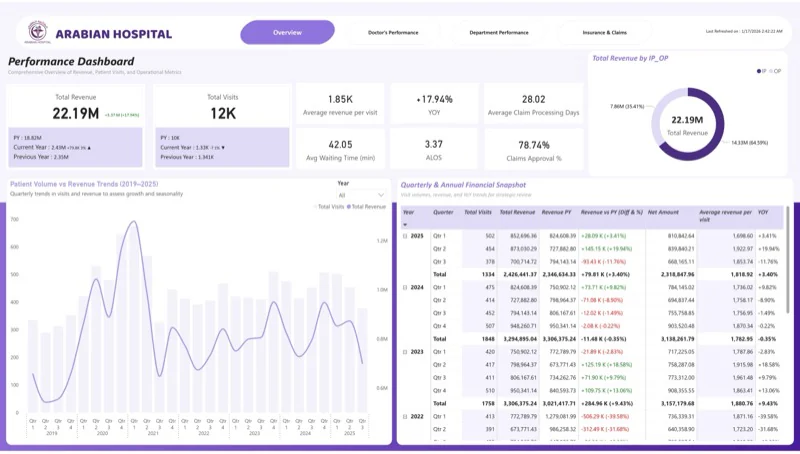 ↗
↗Denial patterns surfaced early
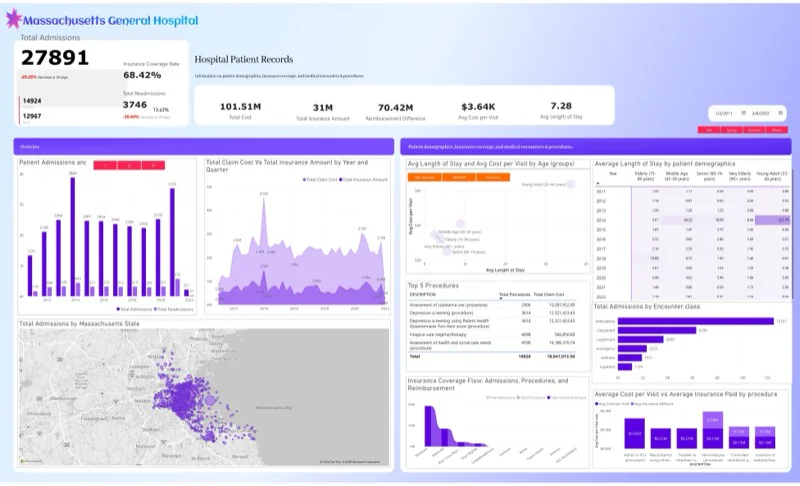 ↗
↗Missed value surfaced and recovered
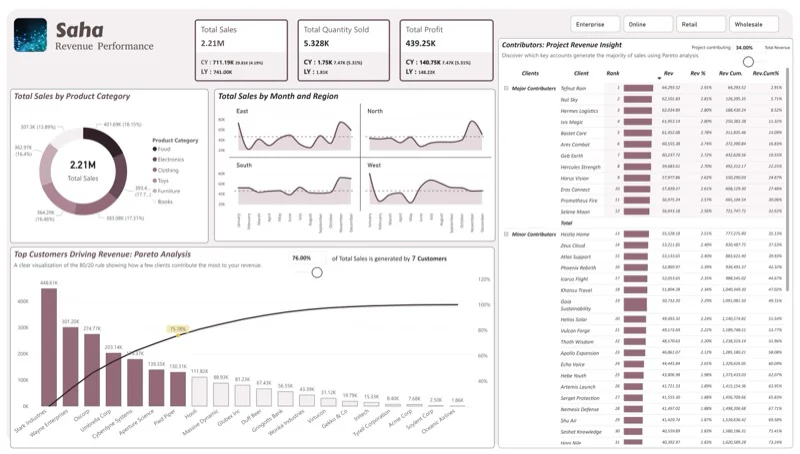 ↗
↗Pipeline movement by tier and rep

I engineer the layer between raw data and decisive leadership.
PL-300 validates my Power BI analysis, modeling, visualization, and governance capability. DP-600 extends that expertise into enterprise-scale Microsoft Fabric analytics, semantic models, warehouses, and lakehouses.
Start with diagnosis, build the system, or embed senior BI leadership into your team.
A forensic review of your data landscape, reporting friction, and decision gaps.
A complete Power BI decision layer engineered around your revenue model.
Senior BI direction without the full-time leadership overhead.
This estimate converts reporting time into annual strategy capacity. Select your currency, then adjust the inputs to match your team.
Recover the time ↗د.إ 19,800 per week is tied up in reporting.
Sharp thinking on the metrics, behaviors, and reporting habits that decide whether growth compounds—or leaks.
Bring one decision your current reporting cannot answer. The first strategy conversation is complimentary.
Book a strategy call ↗